Course description
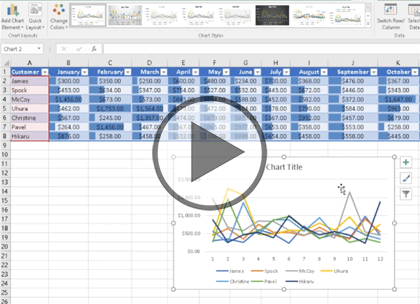
Explore an amazing set of topics in analysis and forecasting in this course which covers topics including Goal Seek, Scenarios, Solver, and Data Analysis. Learn to use Goal Seek’s capabilities when a value is unknown, explore Scenarios which allow for multiple views of how data changes based on set values, use the Solver to generate multiple solutions using objectives, variables and constraints, and explore the instant data analysis tools to quickly get what you need in order to enhance your data.
Prerequisites
This course is designed for students with a base knowledge of Excel and want to learn higher-level skills to display data and perform functions. Students should know how to perform calculations, modify worksheets, format worksheets, print workbooks and manage workbooks.
Learning Paths
This course is part of the following LearnNowOnline SuccessPaths™:
Microsoft Office Advanced
Meet the expert
Sondra Nelson is a Microsoft Certified Trainer and has been teaching Microsoft Office for over 15 years. She has teaching and consulting experience with high school students, college students and corporate employees.
Course outline
Analytical Tools
Goal Seek (07:32)
- Introduction (00:28)
- Goal Seek (00:58)
- Goal Seek Calculate Interest Rate Demo (01:33)
- Demo: Calculate Interest Rate (02:05)
- Goal Seek Voting Results Demo (00:45)
- Demo: Voting Results (01:19)
- Summary (00:21)
Scenarios (17:50)
- Introduction (00:25)
- Scenarios (00:44)
- Scenarios Demo (00:28)
- Demo: Scenarios (01:03)
- Worst-Case Scenario (00:44)
- Demo: Worst-Case Scenario (02:17)
- Worst-Case Scenario Continued (01:02)
- Demo: Worst-Case Scenario Continued (01:32)
- Best-Case Scenario (01:27)
- Demo: Best-Case Scenario (04:05)
- Scenario Summary (01:10)
- Demo: Scenario Summary (02:28)
- Summary (00:20)
Solver (12:25)
- Introduction (00:20)
- Solver (00:36)
- Solver Demo (02:18)
- Demo: Using the Solver (05:16)
- Solver Demo Continued (01:14)
- Demo: Answer Report (02:21)
- Summary (00:17)
Instant Data Analysis (11:41)
- Introduction (00:22)
- Instant Data Analysis (00:40)
- Instant Data Analysis Formatting Demo (00:35)
- Instant Data Analysis Charts Demo (00:35)
- Demo: Formatting and Charts (02:56)
- Instant Data Analysis Totals Demo (00:46)
- Instant Data Analysis Tables Demo (00:32)
- Instant Data Analysis Sparklines Demo (00:43)
- Demo: Totals, Tables, and Sparklines (04:15)
- Summary (00:14)


