Course description
Data Science is a growing field, this final course in the series discusses how to tell an effective story as well as using alternate data sources.
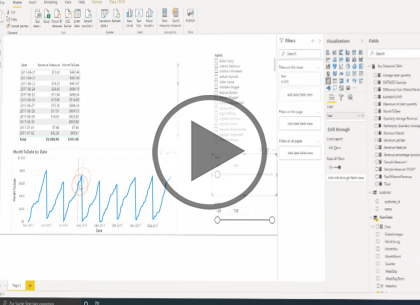
Data Analysts are responsible for designing and building scalable data models, cleaning and transforming data, and enabling advanced analytic capabilities that provide meaningful business value through easy-to-comprehend data visualizations. The PL-300 Exam validates this expertise.
Prerequisites
Experience with Microsoft Excel, pivot tables and power pivot modelling is helpful.
Meet the expert
Nikolai is a mathematician and works as a data scientist in a large German company. He is focused mainly on gaining insights from data and creating a positive impact with this knowledge.
Course outline
Storytelling and Cloud
Tell a Story (22:13)
- Introduction (00:13)
- Best Practices (01:01)
- Show Empathy & Identify the requirements (02:37)
- Finding the most suitable KPIs (02:18)
- Choose an effective visualization (03:39)
- Make use of natural reading pattern (02:58)
- Tell a story using visual cues (05:21)
- Avoid Chaos & Group information (02:17)
- Storytelling with data (01:41)
- Summary (00:08)
How Do We Go on Now (29:50)
- Introduction (00:08)
- How do we go on now (03:13)
- Power BI Pro vs. Premium & Registration (03:54)
- Exploring the Workspaces (04:10)
- Discovering the workspaces (02:31)
- Connecting Power BI Desktop & Cloud (04:00)
- Understanding Datasets & Reports (03:24)
- Working with the reports (03:53)
- Updating the reports from Power BI Desktop (04:29)
- Summary (00:08)
Creating and Working with Workspaces (27:00)
- Introduction (00:08)
- Creating and working with Workspaces (07:13)
- Installing & Using a Data Gateway (12:53)
- Get Quick Insights (02:33)
- Creating Dashboards (04:05)
- Summary (00:08)
More Data Sources
Sharing Our Results Through Apps (26:55)
- Introduction (00:13)
- Sharing our results through Apps (10:09)
- Power BI Mobile App (05:26)
- Creating the layout for the Mobile App (03:46)
- Cloud Wrap up (07:13)
- Summary (00:08)
More Data Sources (34:14)
- Introduction (00:08)
- JSON & REST API (09:57)
- Setting up a local MySQL database (14:01)
- Connecting to a SQL database (04:59)
- Power BI & SQL database (PostgreSQL) (05:01)
- Summary (00:08)


